B92_MWAvg
- class dust_extinction.averages.B92_MWAvg(*args, meta=None, name=None, **kwargs)[source]
Bases:
BaseExtModelBastiaansen (1992) Optical Extinction Curve
- Parameters:
None
- Raises:
None –
Notes
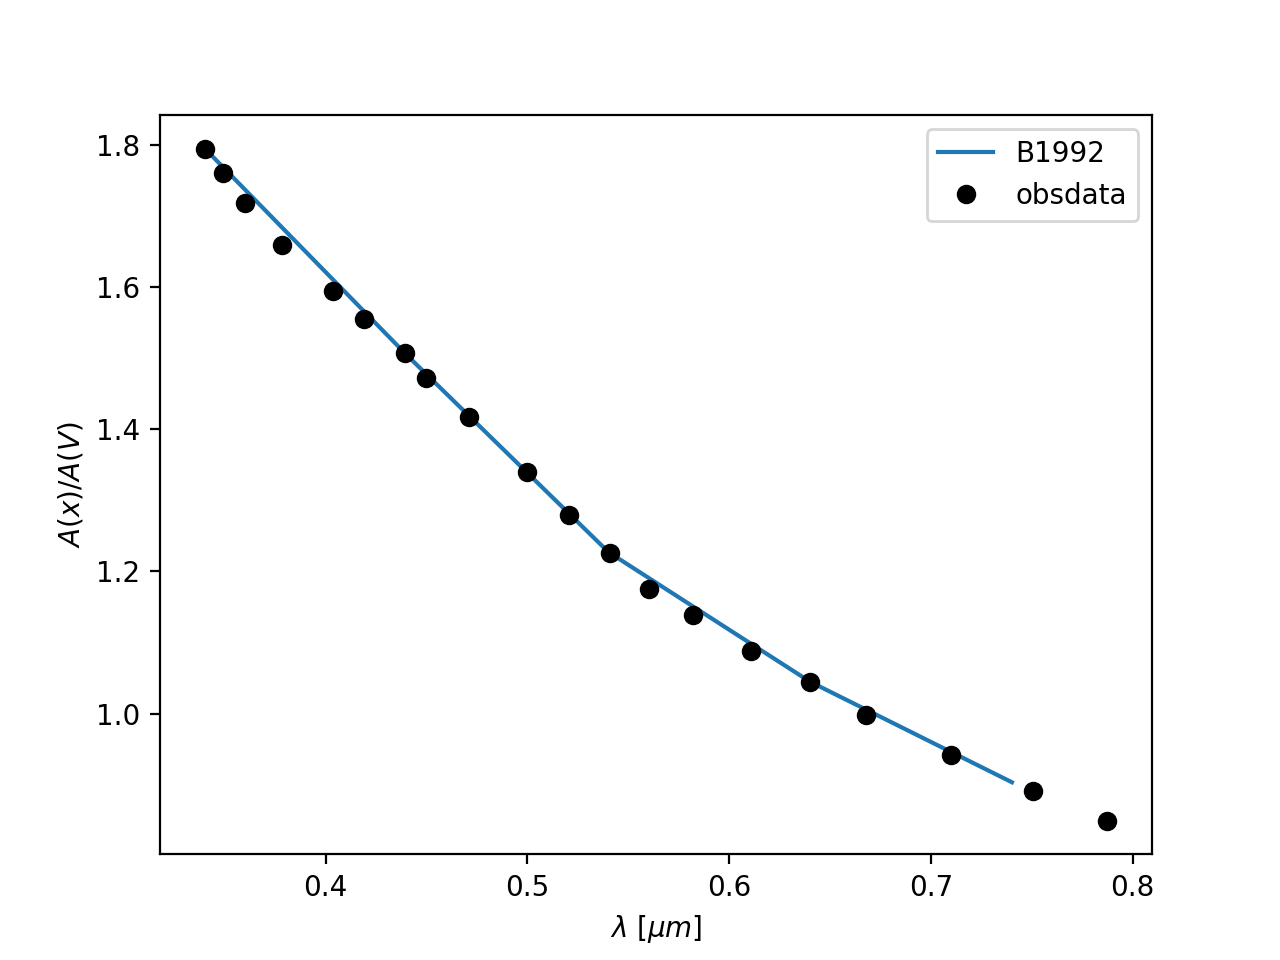
From Bastiaansen (1992, A&AS, 93, 449-462)
Example showing the average curve
import numpy as np
import matplotlib.pyplot as plt
import astropy.units as u

from dust_extinction.averages import B92_MWAvg

fig, ax = plt.subplots()

# define the extinction model
ext_model = B92_MWAvg()

# generate the curves and plot them
x = np.arange(1.0/ext_model.x_range[1], 1.0/ext_model.x_range[0], 0.1) * u.micron

ax.plot(x,ext_model(x),label='B92')
ax.plot(1.0/ext_model.obsdata_x, ext_model.obsdata_axav, 'ko',
        label='obsdata')

ax.set_xlabel(r'$\lambda$ [$\mu m$]')
ax.set_ylabel(r'$A(x)/A(V)$')

ax.legend(loc='best')
plt.show()
(
Source code,png,hires.png,pdf)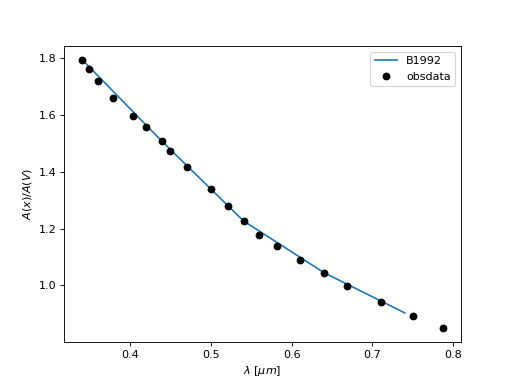
Attributes Summary
Methods Summary
evaluate(x)B92 function
Attributes Documentation
- EVBm15_E22m15 = array([0.43827606, 1.09630729])
- Rv = 3.1
- obsdata_Elm15_E22m15 = array([-0.327, -0.236, -0.128, -0.004, 0.098, 0.19 , 0.301, 0.383, 0.491, 0.606, 0.738, 0.907, 1.027, 1.1 , 1.206, 1.292, 1.431, 1.559, 1.651, 1.725])
- obsdata_axav = array([0.6248457 , 0.6694558 , 0.72239965, 0.78318704, 0.83318957, 0.87828989, 0.93270441, 0.97290252, 1.02584638, 1.08222178, 1.14693093, 1.22977826, 1.28860476, 1.32439089, 1.3763543 , 1.4185133 , 1.486654 , 1.54940227, 1.59450259, 1.63077893])
- obsdata_elvebv = array([-1.16297833, -1.02468702, -0.86056107, -0.67212017, -0.51711233, -0.37730133, -0.20861633, -0.08400218, 0.08012377, 0.25488751, 0.45548589, 0.7123126 , 0.89467477, 1.00561175, 1.16669833, 1.29739122, 1.50862739, 1.70314704, 1.84295803, 1.9554147 ])
- obsdata_tolerance = 0.006
- obsdata_x = array([1.27016385, 1.33244504, 1.40805407, 1.49678192, 1.5625 , 1.6374652 , 1.71791788, 1.78539547, 1.84945441, 1.92122959, 2.00040008, 2.12404418, 2.22419929, 2.27531286, 2.38549618, 2.4764735 , 2.64200793, 2.77777778, 2.86286859, 2.93944738])
- x_range = [1.2701638511367968, 2.9394473838918285]
Methods Documentation
- classmethod evaluate(x)[source]
B92 function
- Parameters:
x (float) –
expects either x in units of wavelengths or frequency or assumes wavelengths in wavenumbers [1/micron]
internally wavenumbers are used
- Returns:
axav – A(x)/A(V) extinction curve [mag]
- Return type:
np array (float)
- Raises:
ValueError – Input x values outside of defined range