F19
- class dust_extinction.parameter_averages.F19(Rv=3.1, **kwargs)[source]
Bases:
BaseExtRvModelFitzpatrick et al (2019) extinction model calculation
Fitzpatrick, Massa, Gordon et al. (2019, ApJ, 886, 108) model. Based on a sample of stars observed spectroscopically in the optical with HST/STIS.
- Parameters:
Rv (float) – R(V) = A(V)/E(B-V) = total-to-selective extinction
- Raises:
InputParameterError – Input Rv values outside of defined range
Notes
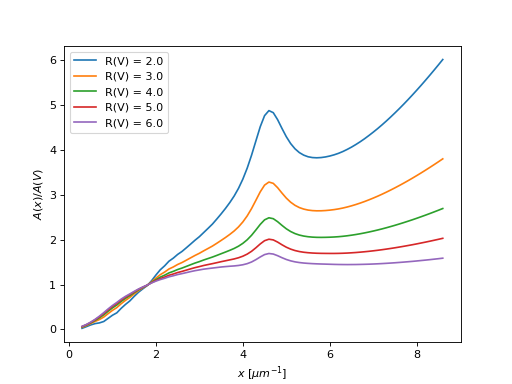
F19 Milky Way R(V) dependent extinction model
Example showing F19 curves for a range of R(V) values.
import numpy as np
import matplotlib.pyplot as plt
import astropy.units as u

from dust_extinction.parameter_averages import F19

fig, ax = plt.subplots()

# temp model to get the correct x range
text_model = F19()

# generate the curves and plot them
x = np.arange(text_model.x_range[0],
              text_model.x_range[1],0.1)/u.micron

Rvs = [2.0, 3.0, 4.0, 5.0, 6.0]
for cur_Rv in Rvs:
   ext_model = F19(Rv=cur_Rv)
   ax.plot(x,ext_model(x),label='R(V) = ' + str(cur_Rv))

ax.set_xlabel(r'$x$ [$\mu m^{-1}$]')
ax.set_ylabel(r'$A(x)/A(V)$')

# for 2nd x-axis with lambda values
axis_xs = np.array([0.1, 0.12, 0.15, 0.2, 0.3, 0.5, 1.0])
new_ticks = 1 / axis_xs
new_ticks_labels = ["%.2f" % z for z in axis_xs]
tax = ax.twiny()
tax.set_xlim(ax.get_xlim())
tax.set_xticks(new_ticks)
tax.set_xticklabels(new_ticks_labels)
tax.set_xlabel(r"$\lambda$ [$\mu$m]")

ax.legend(loc='best')
plt.show()
(
Source code,png,hires.png,pdf)
Attributes Summary
Methods Summary
evaluate(x, Rv)F19 function
Attributes Documentation
- Rv_range = [2.0, 6.0]
- x_range = [0.3, 8.7]
Methods Documentation
- evaluate(x, Rv)[source]
F19 function
- Parameters:
x (float) –
expects either x in units of wavelengths or frequency or assumes wavelengths in wavenumbers [1/micron]
internally wavenumbers are used
- Returns:
axav – A(x)/A(V) extinction curve [mag]
- Return type:
np array (float)
- Raises:
ValueError – Input x values outside of defined range