FM90
- class dust_extinction.shapes.FM90(C1=0.1, C2=0.7, C3=3.23, C4=0.41, xo=4.59, gamma=0.95, **kwargs)[source]
Bases:
BaseExtModel,Fittable1DModelFitzpatrick & Massa (1990) 6 parameter ultraviolet shape model
- Parameters:
Notes
From Fitzpatrick & Massa (1990, ApJS, 72, 163)
Only applicable at UV wavelengths
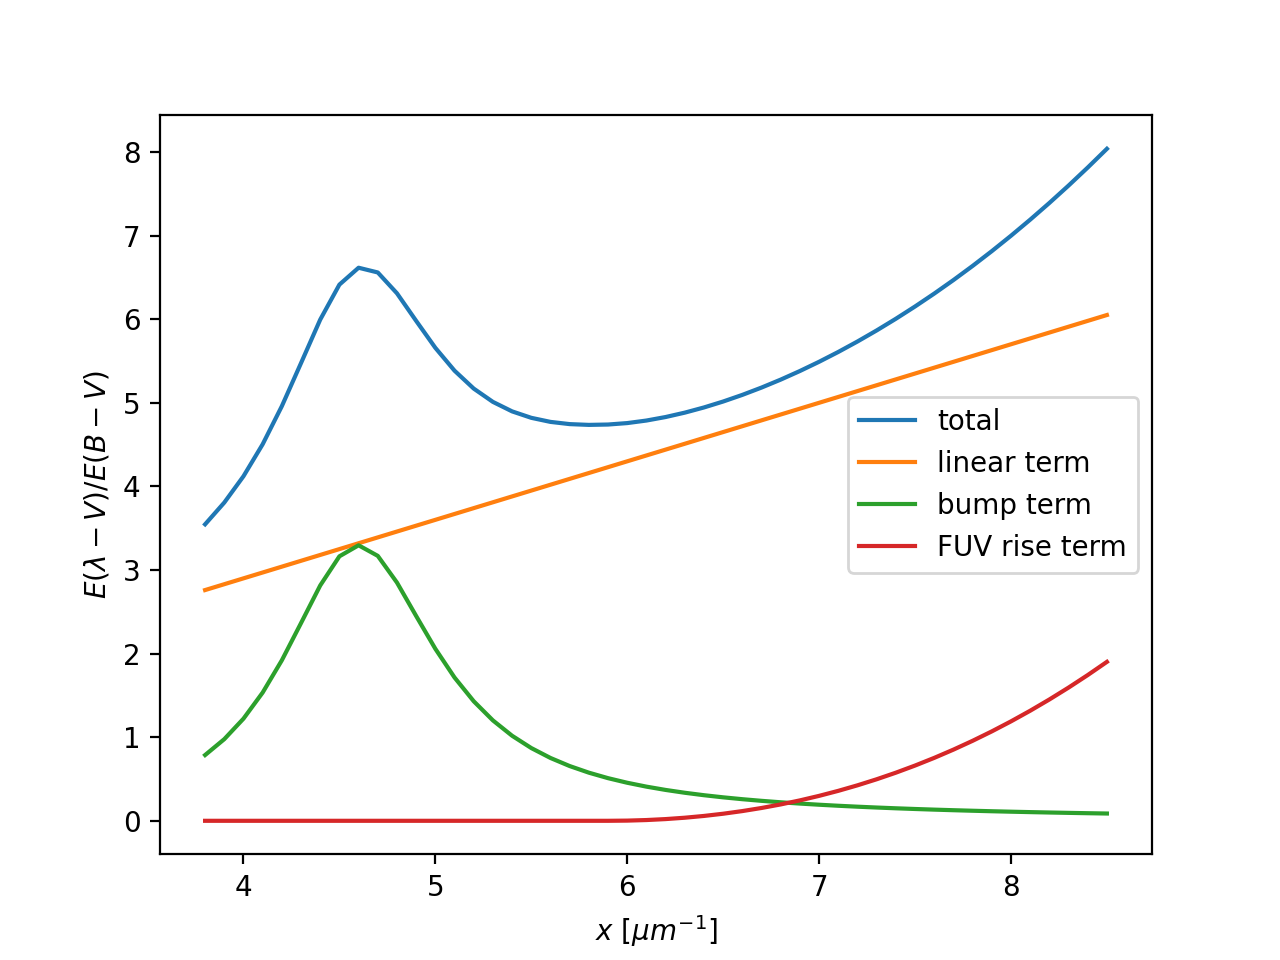
Example showing a FM90 curve with components identified.
import numpy as np
import matplotlib.pyplot as plt
import astropy.units as u

from dust_extinction.shapes import FM90

fig, ax = plt.subplots()

# generate the curves and plot them
x = np.arange(3.8,8.6,0.1)/u.micron

ext_model = FM90()
ax.plot(x,ext_model(x),label='total')

ext_model = FM90(C3=0.0, C4=0.0)
ax.plot(x,ext_model(x),label='linear term')

ext_model = FM90(C1=0.0, C2=0.0, C4=0.0)
ax.plot(x,ext_model(x),label='bump term')

ext_model = FM90(C1=0.0, C2=0.0, C3=0.0)
ax.plot(x,ext_model(x),label='FUV rise term')

ax.set_xlabel(r'$x$ [$\mu m^{-1}$]')
ax.set_ylabel(r'$E(\lambda - V)/E(B - V)$')

# for 2nd x-axis with lambda values
axis_xs = np.array([0.12, 0.15, 0.2, 0.3])
new_ticks = 1 / axis_xs
new_ticks_labels = ["%.2f" % z for z in axis_xs]
tax = ax.twiny()
tax.set_xlim(ax.get_xlim())
tax.set_xticks(new_ticks)
tax.set_xticklabels(new_ticks_labels)
tax.set_xlabel(r"$\lambda$ [$\mu$m]")

ax.legend(loc='best')
plt.show()
(
Source code,png,hires.png,pdf)
Attributes Summary
Names of the parameters that describe models of this type.
Methods Summary
__call__(*inputs[, model_set_axis, ...])Evaluate this model using the given input(s) and the parameter values that were specified when the model was instantiated.
evaluate(x, C1, C2, C3, C4, xo, gamma)FM90 function
fit_deriv(x, C1, C2, C3, C4, xo, gamma)Derivatives of the FM90 function with respect to the parameters
Attributes Documentation
- C1 = Parameter('C1', value=0.1, bounds=(-10.0, 5.0))
- C2 = Parameter('C2', value=0.7, bounds=(-0.1, 5.0))
- C3 = Parameter('C3', value=3.23, bounds=(-1.0, 6.0))
- C4 = Parameter('C4', value=0.41, bounds=(-0.5, 1.5))
- gamma = Parameter('gamma', value=0.95, bounds=(0.6, 1.7))
- n_inputs = 1
- n_outputs = 1
- param_names = ('C1', 'C2', 'C3', 'C4', 'xo', 'gamma')
Names of the parameters that describe models of this type.
The parameters in this tuple are in the same order they should be passed in when initializing a model of a specific type. Some types of models, such as polynomial models, have a different number of parameters depending on some other property of the model, such as the degree.
When defining a custom model class the value of this attribute is automatically set by the
Parameterattributes defined in the class body.
- x_range = [2.857142857142857, 11.11111111111111]
- xo = Parameter('xo', value=4.59, bounds=(4.5, 4.9))
Methods Documentation
- __call__(*inputs, model_set_axis=None, with_bounding_box=False, fill_value=nan, equivalencies=None, inputs_map=None, **new_inputs)
Evaluate this model using the given input(s) and the parameter values that were specified when the model was instantiated.
- static evaluate(x, C1, C2, C3, C4, xo, gamma)[source]
FM90 function
- Parameters:
x (float) –
expects either x in units of wavelengths or frequency or assumes wavelengths in wavenumbers [1/micron]
internally wavenumbers are used
- Returns:
exvebv – E(x-V)/E(B-V) extinction curve [mag]
- Return type:
np array (float)
- Raises:
ValueError – Input x values outside of defined range