G03_LMCAvg
-
class
dust_extinction.averages.G03_LMCAvg(*args, meta=None, name=None, **kwargs)[source]¶ Bases:
dust_extinction.baseclasses.BaseExtAveModelG03 LMCAvg Average Extinction Curve
Parameters: - None
Raises: - None
Notes
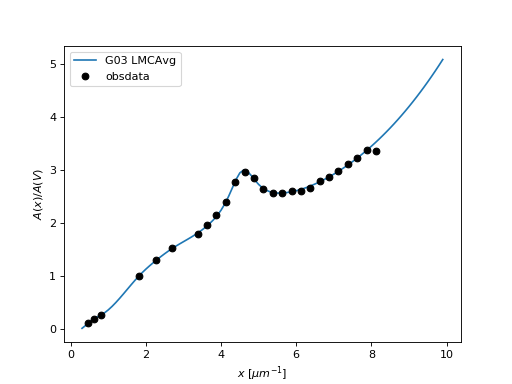
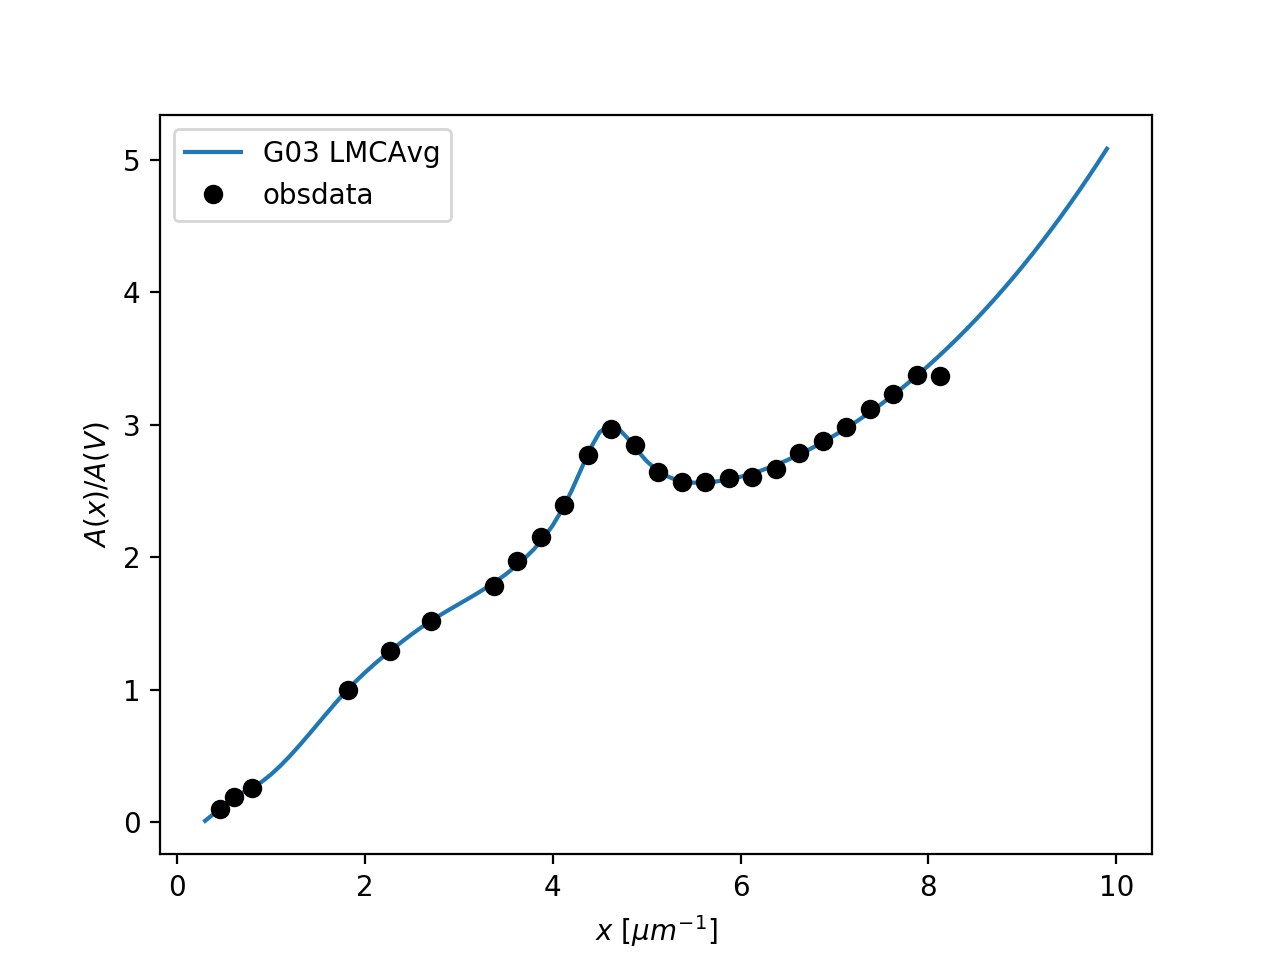
LMCAvg G03 average extinction curve
From Gordon et al. (2003, ApJ, 594, 279)
Example showing the average curve
import numpy as np
import matplotlib.pyplot as plt
import astropy.units as u

from dust_extinction.averages import G03_LMCAvg

fig, ax = plt.subplots()

# define the extinction model
ext_model = G03_LMCAvg()

# generate the curves and plot them
x = np.arange(ext_model.x_range[0], ext_model.x_range[1],0.1)/u.micron

ax.plot(x,ext_model(x),label='G03 LMCAvg')
ax.plot(ext_model.obsdata_x, ext_model.obsdata_axav, 'ko',
        label='obsdata')

ax.set_xlabel(r'$x$ [$\mu m^{-1}$]')
ax.set_ylabel(r'$A(x)/A(V)$')

ax.legend(loc='best')
plt.show()
(Source code, png, hires.png, pdf)

Attributes Summary
Rvobsdata_axavobsdata_toleranceobsdata_xx_rangeMethods Summary
evaluate(in_x)G03 LMCAvg function Attributes Documentation
-
Rv= 3.41
-
obsdata_axav= array([0.1 , 0.186, 0.257, 1. , 1.293, 1.518, 1.786, 1.969, 2.149, 2.391, 2.771, 2.967, 2.846, 2.646, 2.565, 2.566, 2.598, 2.607, 2.668, 2.787, 2.874, 2.983, 3.118, 3.231, 3.374, 3.366])
-
obsdata_tolerance= 0.06
-
obsdata_x= array([0.455, 0.606, 0.8 , 1.818, 2.273, 2.703, 3.375, 3.625, 3.875, 4.125, 4.375, 4.625, 4.875, 5.125, 5.375, 5.625, 5.875, 6.125, 6.375, 6.625, 6.875, 7.125, 7.375, 7.625, 7.875, 8.125])
-
x_range= [0.3, 10.0]
Methods Documentation
-
evaluate(in_x)[source]¶ G03 LMCAvg function
Parameters: - in_x: float
expects either x in units of wavelengths or frequency or assumes wavelengths in wavenumbers [1/micron]
internally wavenumbers are used
Returns: - axav: np array (float)
A(x)/A(V) extinction curve [mag]
Raises: - ValueError
Input x values outside of defined range