G03_LMC2
-
class
dust_extinction.averages.G03_LMC2(*args, meta=None, name=None, **kwargs)[source]¶ Bases:
dust_extinction.baseclasses.BaseExtAveModelGordon et al (2003) LMC2 Average Extinction Curve
- Parameters
- None
- Raises
- None
Notes
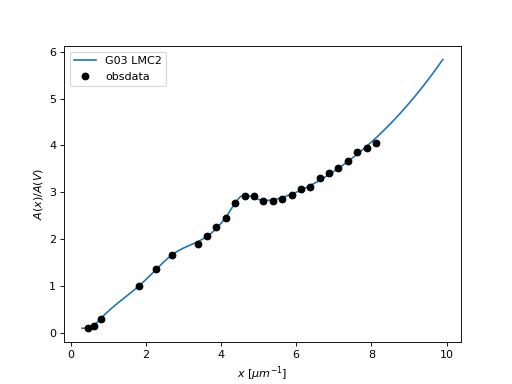
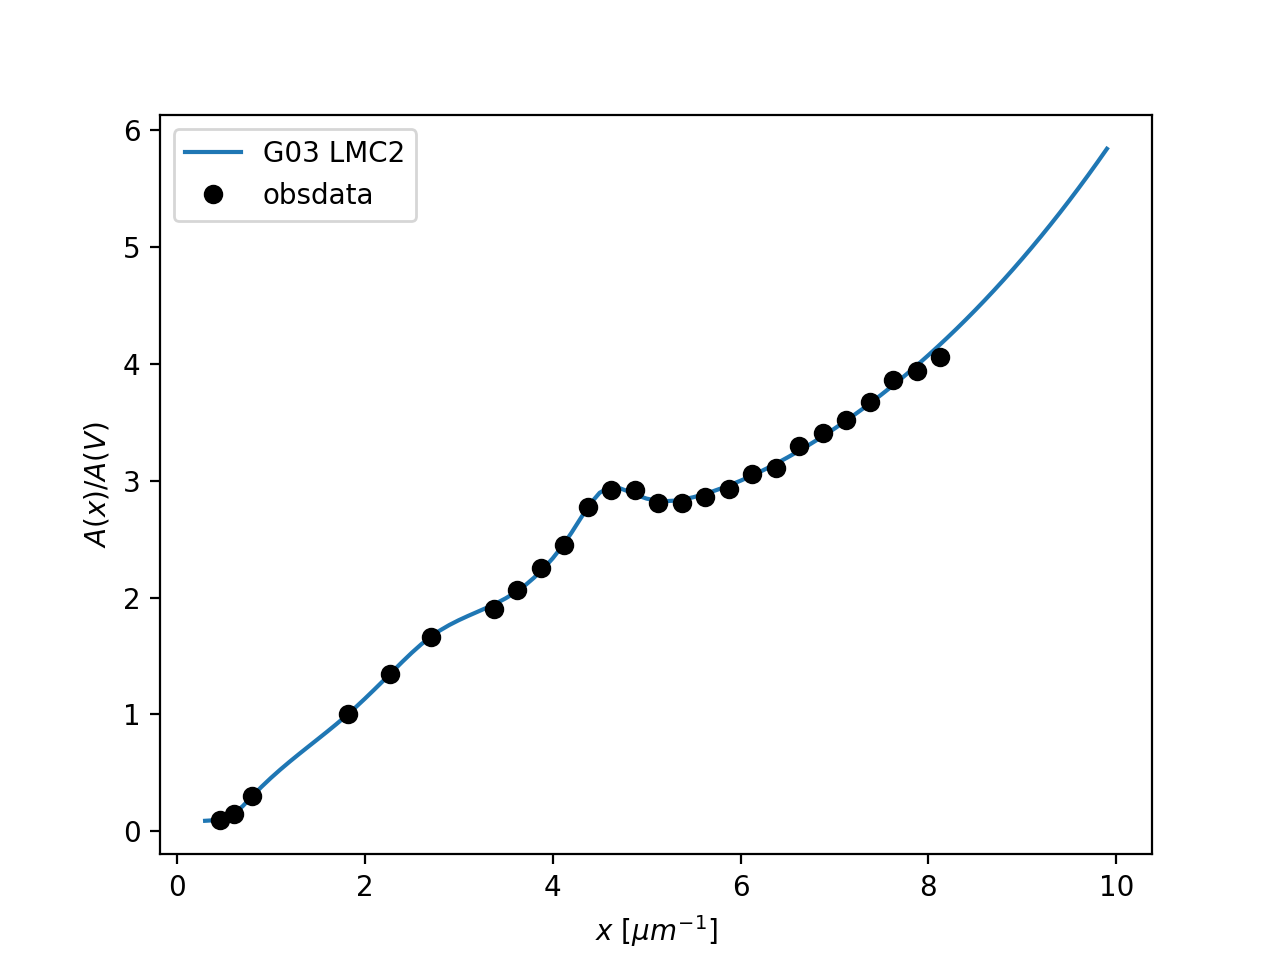
From Gordon et al. (2003, ApJ, 594, 279)
Example showing the average curve
import numpy as np
import matplotlib.pyplot as plt
import astropy.units as u

from dust_extinction.averages import G03_LMC2

fig, ax = plt.subplots()

# generate the curves and plot them
x = np.arange(0.3,10.0,0.1)/u.micron

# define the extinction model
ext_model = G03_LMC2()

# generate the curves and plot them
x = np.arange(ext_model.x_range[0], ext_model.x_range[1],0.1)/u.micron

ax.plot(x,ext_model(x),label='G03 LMC2')
ax.plot(ext_model.obsdata_x, ext_model.obsdata_axav, 'ko',
        label='obsdata')

ax.set_xlabel(r'$x$ [$\mu m^{-1}$]')
ax.set_ylabel(r'$A(x)/A(V)$')

ax.legend(loc='best')
plt.show()
(Source code, png, hires.png, pdf)

Attributes Summary
Methods Summary
evaluate(self, in_x)G03 LMC2 function
Attributes Documentation
-
Rv= 2.76
-
obsdata_axav= array([0.101, 0.15 , 0.299, 1. , 1.349, 1.665, 1.899, 2.067, 2.249, 2.447, 2.777, 2.922, 2.921, 2.812, 2.805, 2.863, 2.932, 3.06 , 3.11 , 3.299, 3.408, 3.515, 3.67 , 3.862, 3.937, 4.055])
-
obsdata_tolerance= 0.06
-
obsdata_x= array([0.455, 0.606, 0.8 , 1.818, 2.273, 2.703, 3.375, 3.625, 3.875, 4.125, 4.375, 4.625, 4.875, 5.125, 5.375, 5.625, 5.875, 6.125, 6.375, 6.625, 6.875, 7.125, 7.375, 7.625, 7.875, 8.125])
-
x_range= [0.3, 10.0]
Methods Documentation
-
evaluate(self, in_x)[source]¶ G03 LMC2 function
- Parameters
- in_x: float
expects either x in units of wavelengths or frequency or assumes wavelengths in wavenumbers [1/micron]
internally wavenumbers are used
- Returns
- axav: np array (float)
A(x)/A(V) extinction curve [mag]
- Raises
- ValueError
Input x values outside of defined range