G16
-
class
dust_extinction.parameter_averages.G16(*args, meta=None, name=None, **kwargs)[source]¶ Bases:
dust_extinction.baseclasses.BaseExtRvAfAModelGordon et al (2016) Milky Way, LMC, & SMC R(V) and f_A dependent model
Mixture model between the F99 R(V) dependent model (component A) and the G03_SMCBar model (component B)
- Parameters
- RvA: float
R_A(V) = A(V)/E(B-V) = total-to-selective extinction R(V) of the A component
- fA: float
f_A is the mixture coefficent between the R(V)
- Raises
- InputParameterError
Input RvA values outside of defined range Input fA values outside of defined range
Notes
From Gordon et al. (2016, ApJ, 826, 104)
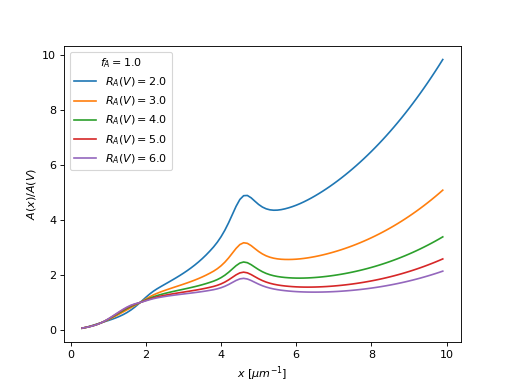
Example showing G16 curves for a range of R_A(V) values and f_A values.
import numpy as np
import matplotlib.pyplot as plt
import astropy.units as u

from dust_extinction.parameter_averages import G16

fig, ax = plt.subplots()

# temp model to get the correct x range
text_model = G16()

# generate the curves and plot them
x = np.arange(text_model.x_range[0],
              text_model.x_range[1],0.1)/u.micron

Rvs = ['2.0','3.0','4.0','5.0','6.0']
for cur_Rv in Rvs:
   ext_model = G16(RvA=cur_Rv, fA=1.0)
   ax.plot(x,ext_model(x),label=r'$R_A(V) = ' + str(cur_Rv) + '$')

ax.set_xlabel(r'$x$ [$\mu m^{-1}$]')
ax.set_ylabel(r'$A(x)/A(V)$')

ax.legend(loc='best', title=r'$f_A = 1.0$')
plt.show()
(Source code, png, hires.png, pdf)
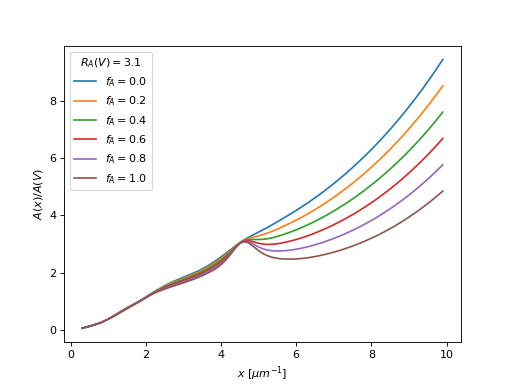
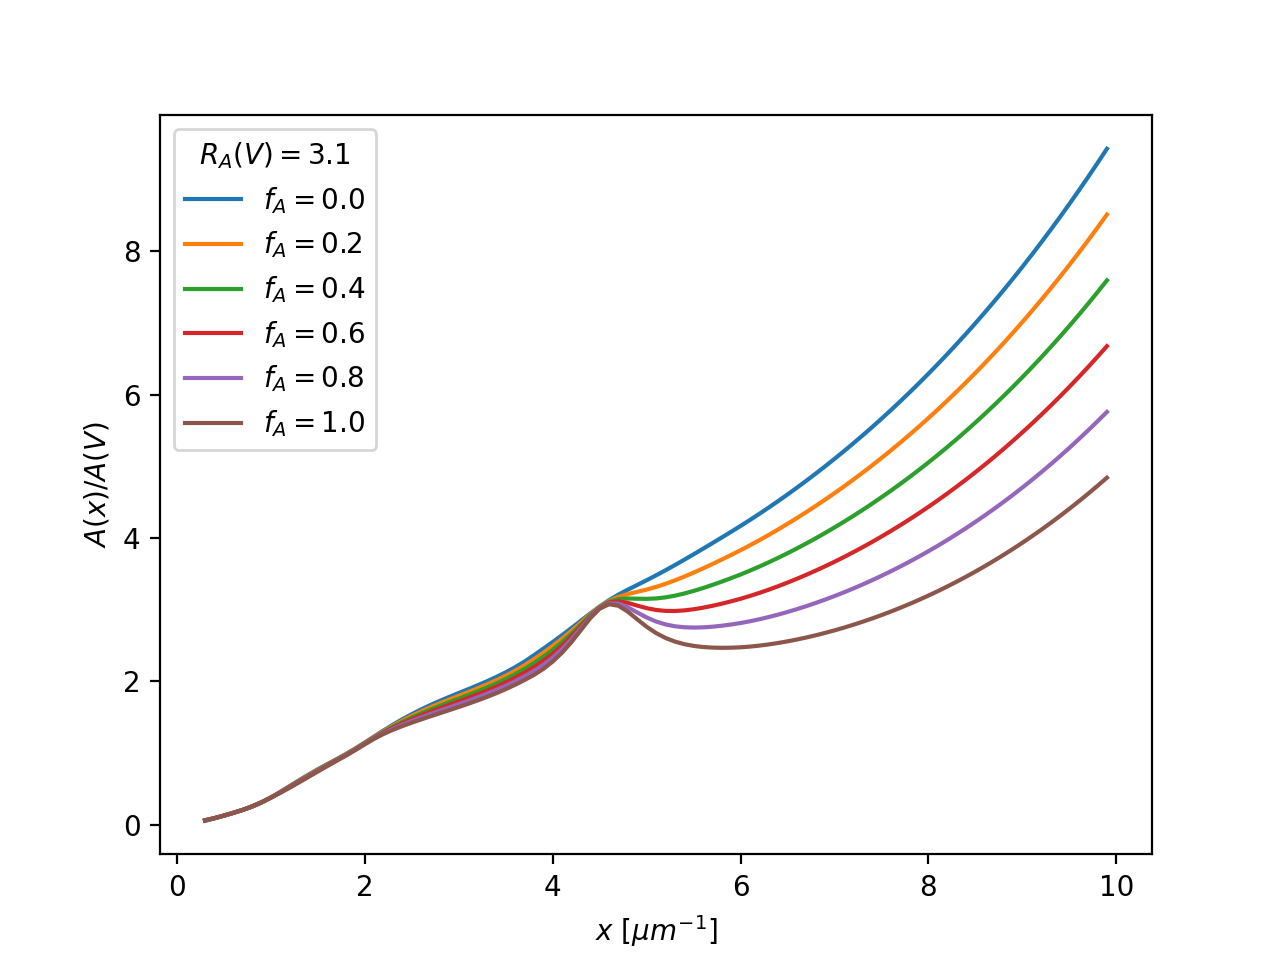
import numpy as np
import matplotlib.pyplot as plt
import astropy.units as u

from dust_extinction.parameter_averages import G16

fig, ax = plt.subplots()

# temp model to get the correct x range
text_model = G16()

# generate the curves and plot them
x = np.arange(text_model.x_range[0],
              text_model.x_range[1],0.1)/u.micron

fAs = [0.0, 0.2, 0.4, 0.6, 0.8, 1.0]
for cur_fA in fAs:
   ext_model = G16(RvA=3.1, fA=cur_fA)
   ax.plot(x,ext_model(x),label=r'$f_A = ' + str(cur_fA) + '$')

ax.set_xlabel(r'$x$ [$\mu m^{-1}$]')
ax.set_ylabel(r'$A(x)/A(V)$')

ax.legend(loc='best', title=r'$R_A(V) = 3.1$')
plt.show()
(Source code, png, hires.png, pdf)

Attributes Summary
Methods Summary
evaluate(in_x, RvA, fA)G16 function
Attributes Documentation
-
RvA_range= [2.0, 6.0]
-
fA_range= [0.0, 1.0]
-
x_range= [0.3, 10.0]
Methods Documentation
-
static
evaluate(in_x, RvA, fA)[source]¶ G16 function
- Parameters
- in_x: float
expects either x in units of wavelengths or frequency or assumes wavelengths in wavenumbers [1/micron]
internally wavenumbers are used
- Returns
- axav: np array (float)
A(x)/A(V) extinction curve [mag]
- Raises
- ValueError
Input x values outside of defined range