I05_MWAvg
- class dust_extinction.averages.I05_MWAvg(*args, meta=None, name=None, **kwargs)[source]
Bases:
BaseExtModelIndebetouw et al (2005) MW Average Extinction Curve
- Parameters:
None
- Raises:
None –
Notes
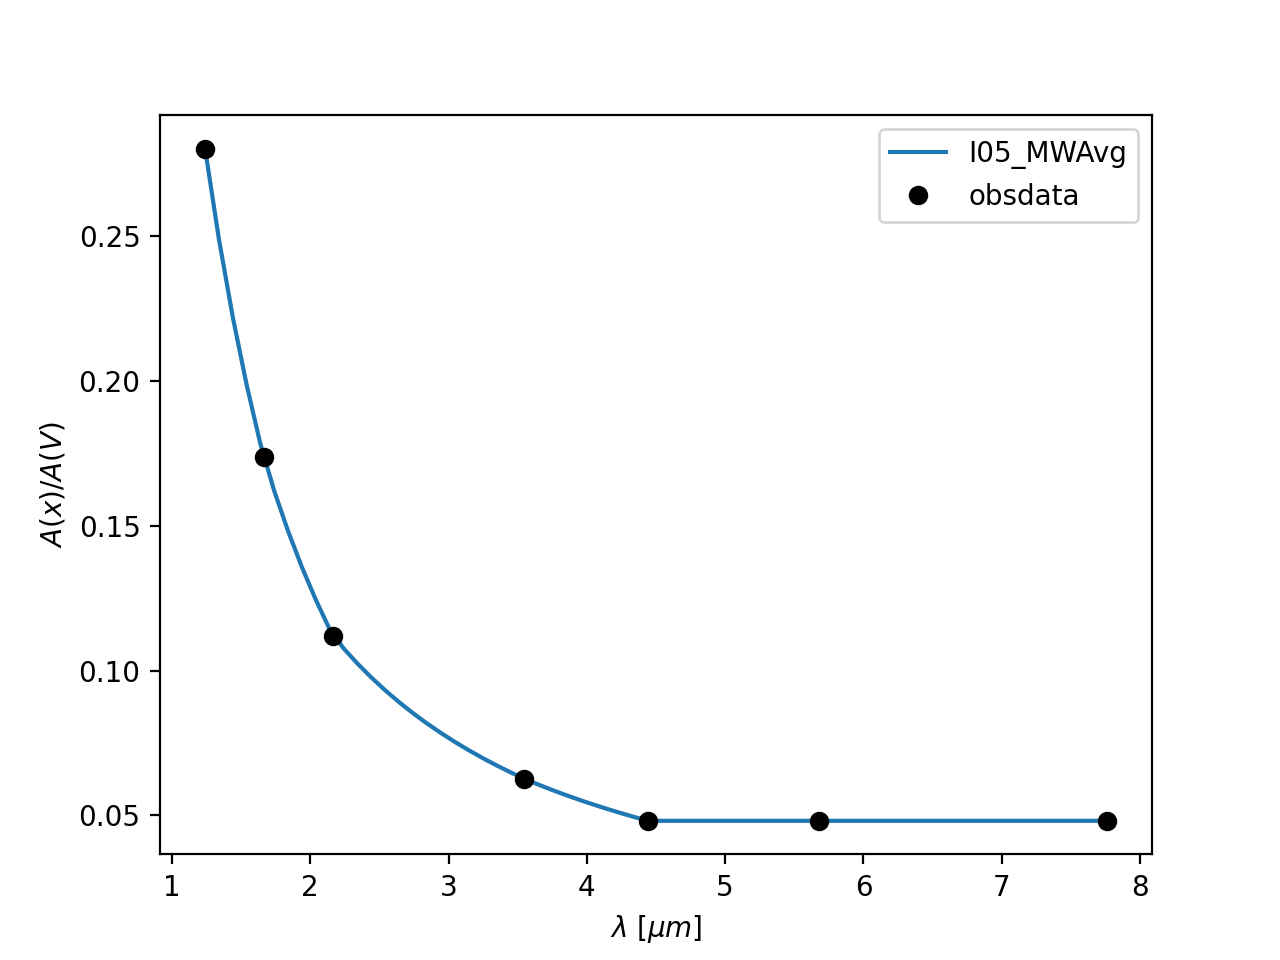
From Indebetouw et al. (2005, ApJ, 619, 931)
Example showing the average curve
import numpy as np
import matplotlib.pyplot as plt
import astropy.units as u

from dust_extinction.averages import I05_MWAvg

fig, ax = plt.subplots()

# define the extinction model
ext_model = I05_MWAvg()

# generate the curves and plot them
x = np.arange(1.0/ext_model.x_range[1], 1.0/ext_model.x_range[0], 0.1) * u.micron

ax.plot(x,ext_model(x),label='I05_MWAvg')
ax.plot(1.0/ext_model.obsdata_x, ext_model.obsdata_axav, 'ko',
        label='obsdata')

ax.set_xlabel(r'$\lambda$ [$\mu m$]')
ax.set_ylabel(r'$A(x)/A(V)$')

ax.legend(loc='best')
plt.show()
(
Source code,png,hires.png,pdf)
Attributes Summary
Methods Summary
evaluate(x)I05 MWAvg function
Attributes Documentation
- Rv = 3.1
- obsdata_axav = array([0.28 , 0.1736 , 0.112 , 0.06272, 0.04816, 0.04816, 0.04816])
- obsdata_axav_unc = array([0.0168 , 0.00896, 0. , 0.00672, 0.00896, 0.0112 , 0.0112 ])
- obsdata_tolerance = 1e-06
- obsdata_x = array([0.80645161, 0.60096154, 0.46210721, 0.28208745, 0.22512382, 0.17621145, 0.12886598])
- x_range = [0.1288659793814433, 0.8064516129032259]
Methods Documentation
- evaluate(x)[source]
I05 MWAvg function
- Parameters:
x (float) –
expects either x in units of wavelengths or frequency or assumes wavelengths in wavenumbers [1/micron]
internally wavenumbers are used
- Returns:
axav – A(x)/A(V) extinction curve [mag]
- Return type:
np array (float)
- Raises:
ValueError – Input x values outside of defined range