RRP89_MWGC
- class dust_extinction.averages.RRP89_MWGC(*args, meta=None, name=None, **kwargs)[source]
Bases:
BaseExtModelReike, Rieke, & Paul (1989) MW Average Extinction Curve
- Parameters:
None
- Raises:
None –
Notes
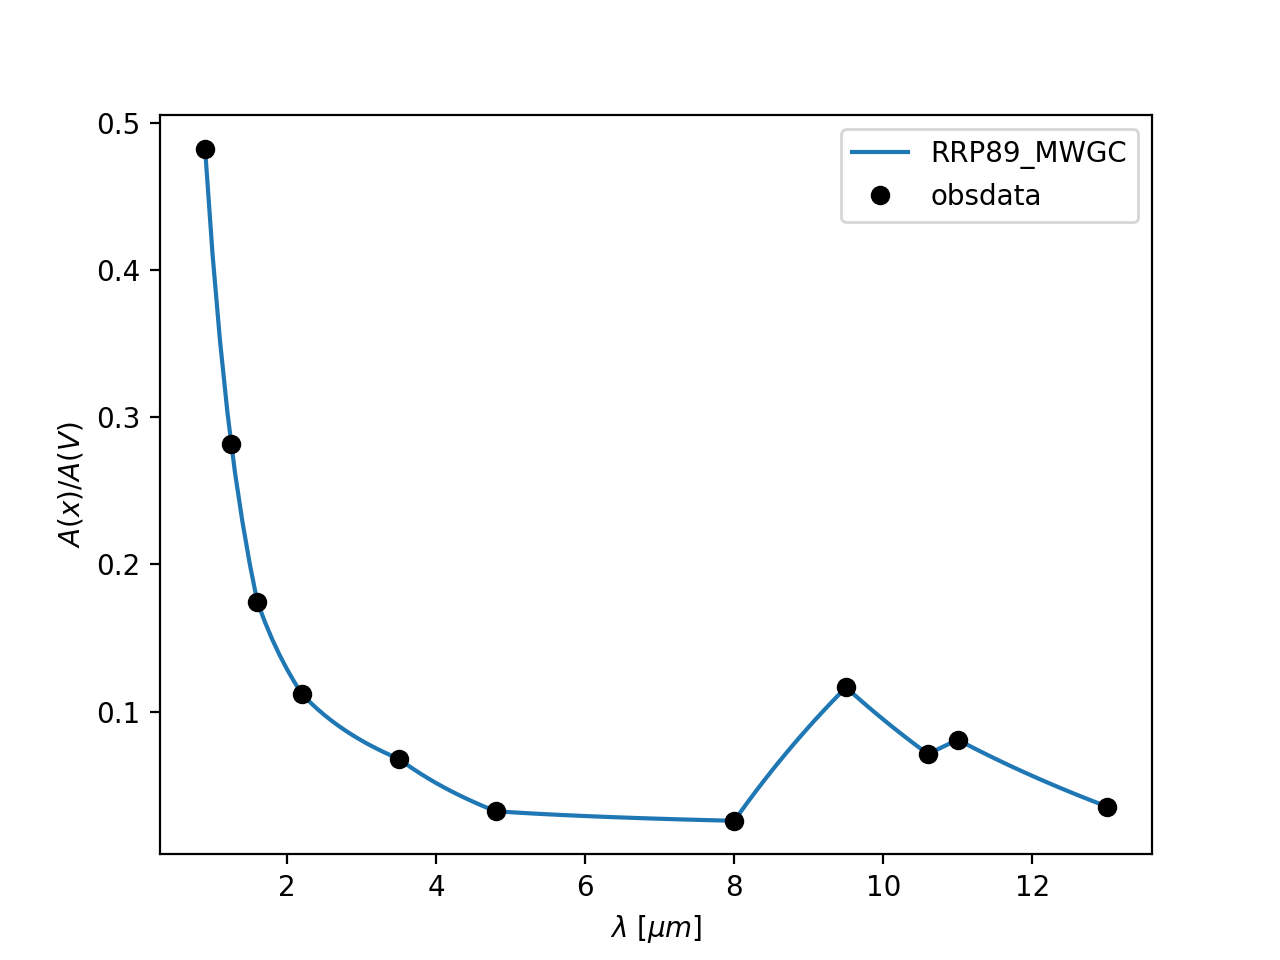
From Rieke, Rieke, & Paul (1989, ApJ, 336, 752)
Example showing the average curve
import numpy as np
import matplotlib.pyplot as plt
import astropy.units as u

from dust_extinction.averages import RRP89_MWGC

fig, ax = plt.subplots()

# define the extinction model
ext_model = RRP89_MWGC()

# generate the curves and plot them
x = np.arange(1.0/ext_model.x_range[1], 1.0/ext_model.x_range[0], 0.1) * u.micron

ax.plot(x,ext_model(x),label='RRP89_MWGC')
ax.plot(1.0/ext_model.obsdata_x, ext_model.obsdata_axav, 'ko',
        label='obsdata')

ax.set_xlabel(r'$\lambda$ [$\mu m$]')
ax.set_ylabel(r'$A(x)/A(V)$')

ax.legend(loc='best')
plt.show()
(
Source code,png,hires.png,pdf)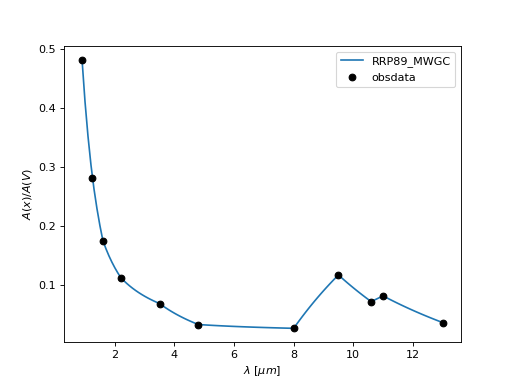
Attributes Summary
Methods Summary
evaluate(x)RRP89 MWGC function
Attributes Documentation
- Rv = 3.09
- obsdata_axav = array([0.48220065, 0.2815534 , 0.17475728, 0.11197411, 0.06796117, 0.03236246, 0.02588997, 0.11650485, 0.07119741, 0.08090615, 0.03559871])
- obsdata_elvebv = array([-1.6 , -2.22 , -2.55 , -2.744, -2.88 , -2.99 , -3.01 , -2.73 , -2.87 , -2.84 , -2.98 ])
- obsdata_tolerance = 1e-06
- obsdata_x = array([1.11111111, 0.8 , 0.625 , 0.45454545, 0.28571429, 0.20833333, 0.125 , 0.10526316, 0.09433962, 0.09090909, 0.07692308])
- x_range = [0.07692307692307693, 1.1111111111111112]
Methods Documentation
- classmethod evaluate(x)[source]
RRP89 MWGC function
- Parameters:
x (float) –
expects either x in units of wavelengths or frequency or assumes wavelengths in wavenumbers [1/micron]
internally wavenumbers are used
- Returns:
axav – A(x)/A(V) extinction curve [mag]
- Return type:
np array (float)
- Raises:
ValueError – Input x values outside of defined range